JLT Apartments as an Investment: What the Yields Look Like
JLT delivers strong yields for the right investors. Here's what JLT yields look like and how to capture them in 2026.
Investors who do this for a living tend to have a few districts they always check first when looking at Dubai apartments. JLT shows up on that list more often than the casual observer would expect. The headline yields are good. The tenant demand is sticky. The price-per-square-foot has stayed reasonable enough that the math works at entry. And the secondary market has enough liquidity that exits happen without major discounting.
We’ve handled JLT investment transactions across most of the 26 clusters over the past several years. The patterns are clear enough to write down. Some clusters consistently outperform on yield. Others outperform on capital growth. A handful do both. The rest sit in the middle of the pack and are fine, not exciting.
This article is the investment-focused counterpart to a separate piece we wrote on what living in JLT actually feels like. The two share a district but cover different ground. If you’re researching JLT as a potential home, that other piece is probably the more useful read. If you’re looking at JLT as a yield play, capital growth play, or hybrid, this is the one.
We’re going to cover the JLT yield landscape and where it sits versus other Dubai districts, where rents have moved over the past three years, the capital growth versus yield trade-off across cluster tiers, our research on what actually delivers, which specific buildings perform versus which look good on paper, and the honest read on what an investor should and shouldn’t expect from JLT in 2026 and beyond.
A note before the numbers. JLT is not the highest-yield district in Dubai. It is, however, one of the most consistent. Yields in the 6.5% to 7.5% range across the cluster, with low volatility, and a tenant pool that doesn’t dry up the way it can in some other districts. For most institutional and serious individual investors we work with, consistency matters more than peak yield. JLT delivers consistency. That’s the core of the case.
The JLT Yield Landscape in 2026
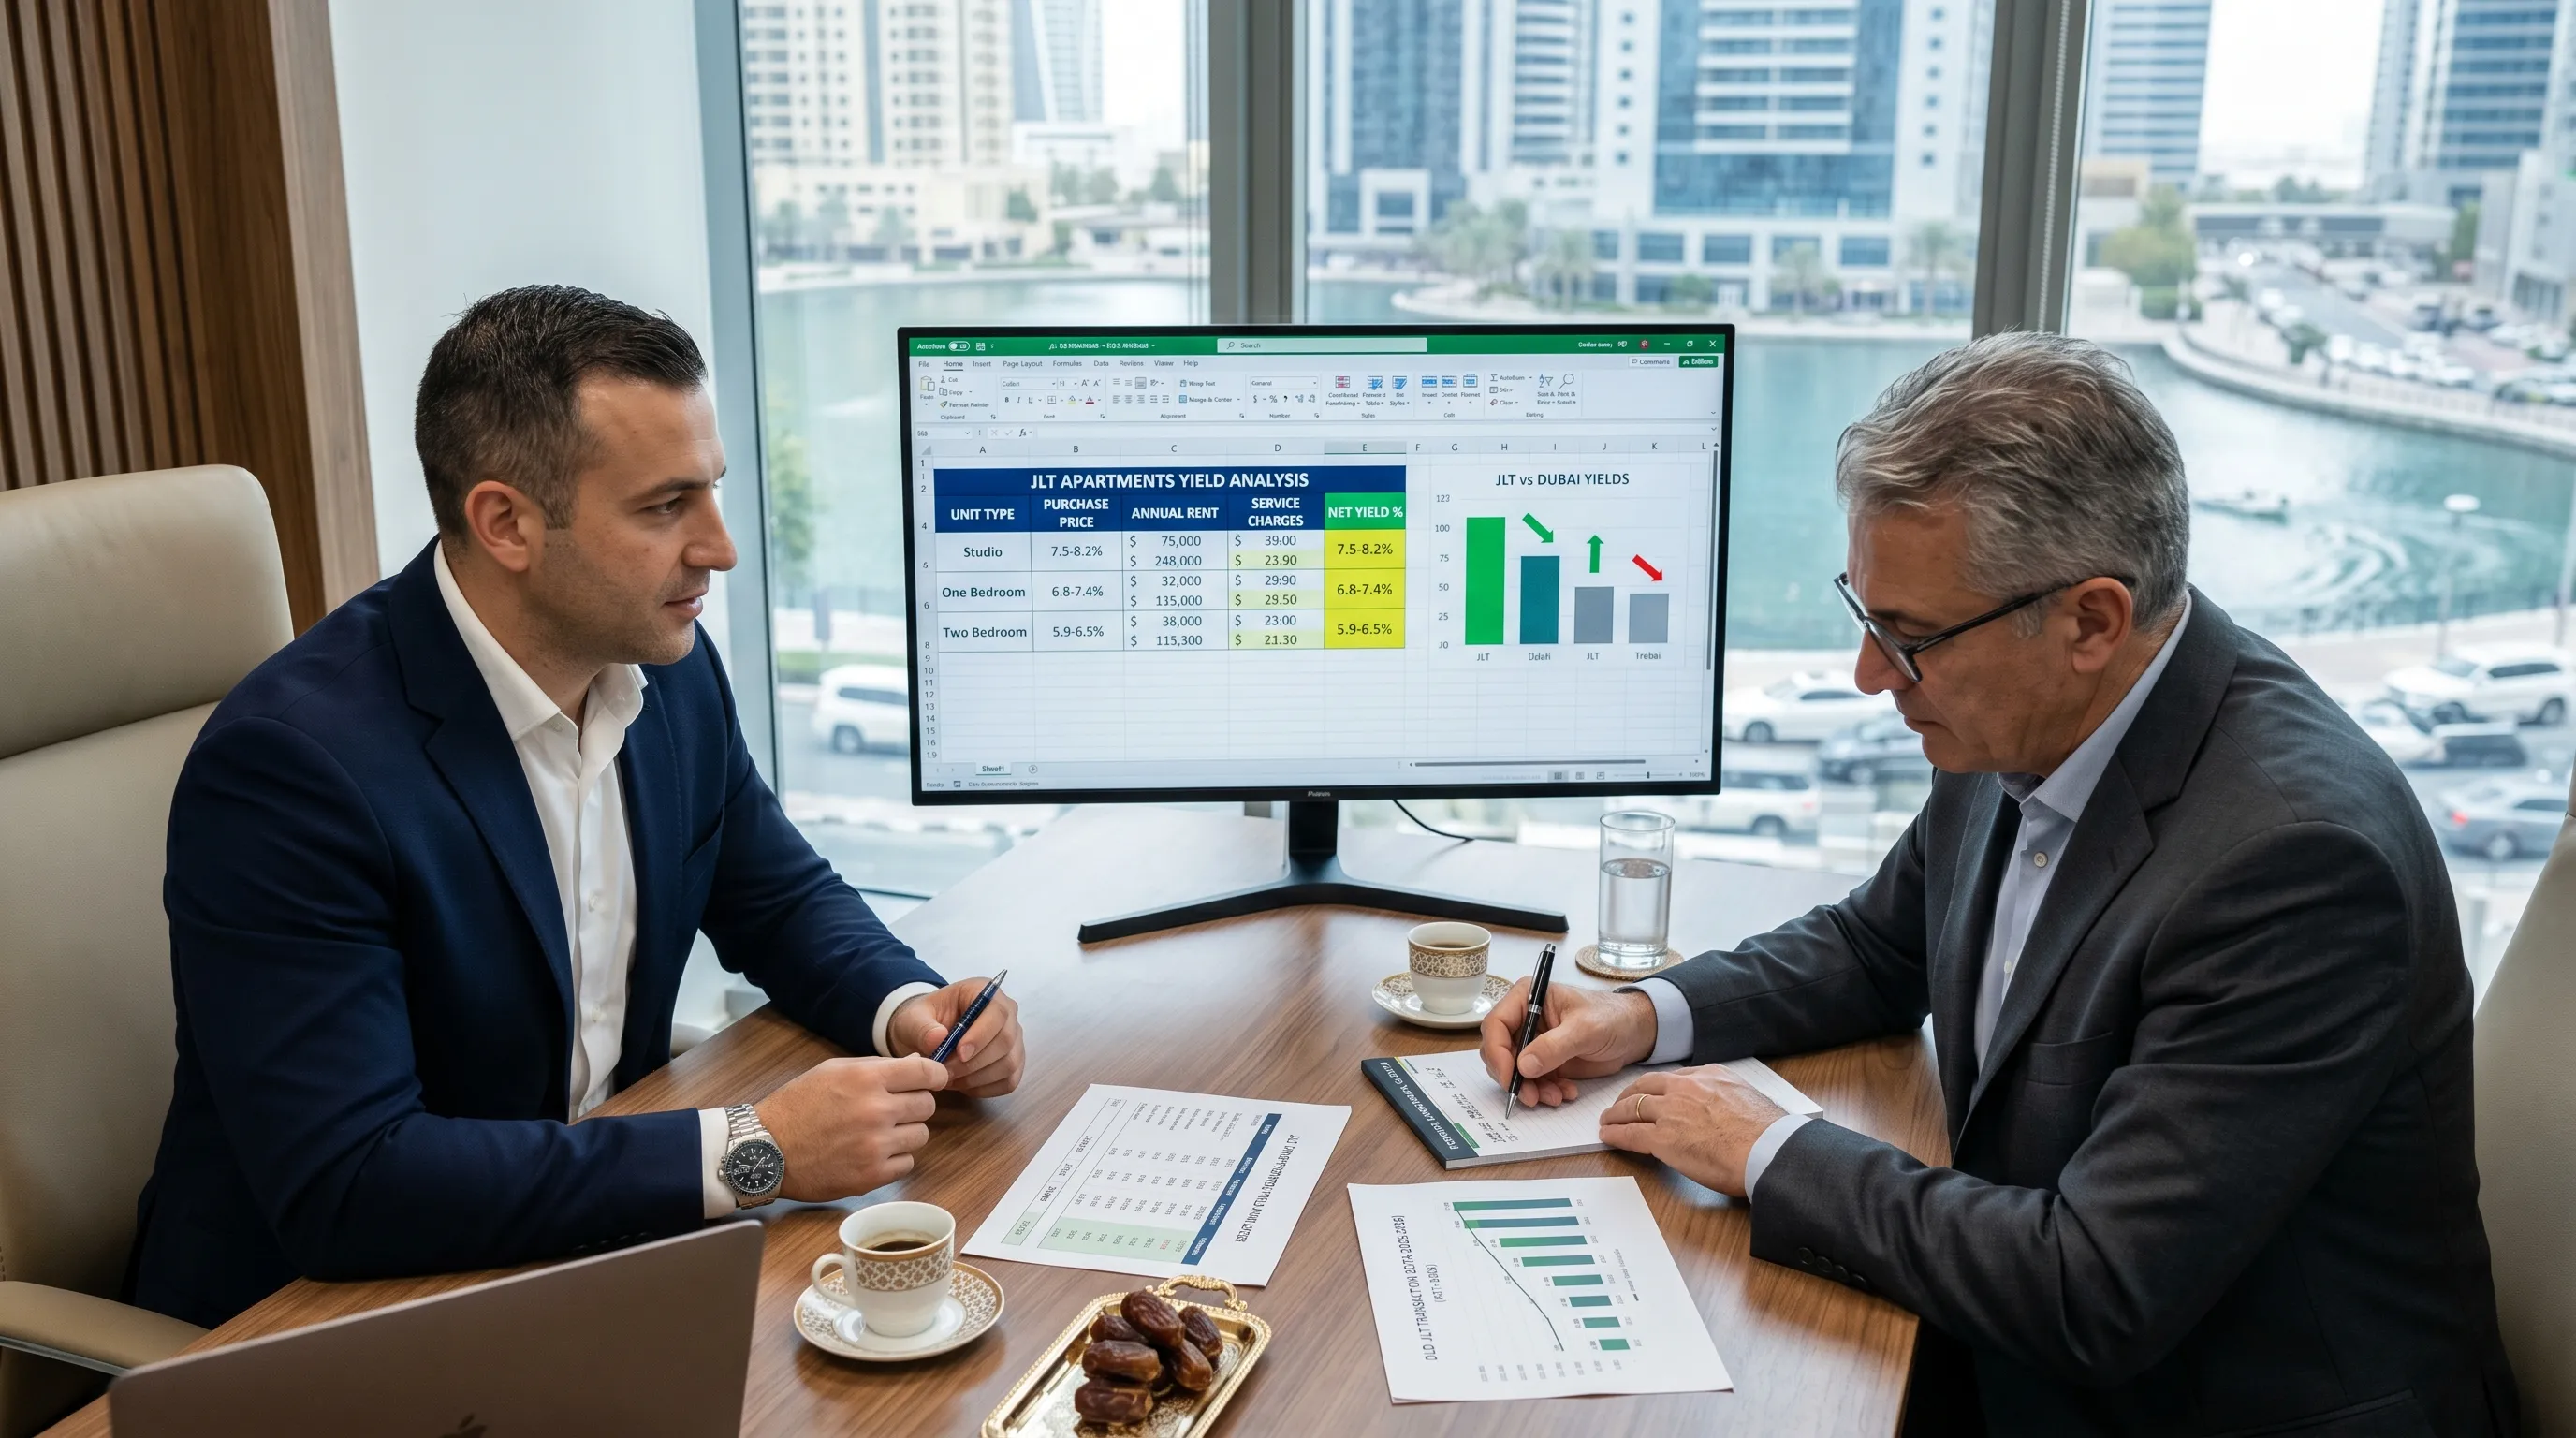
Gross rental yields across JLT in 2026 cluster between 6.5% and 7.8% depending on building, unit type, and view. The median sits around 7.1%. That puts JLT well ahead of Downtown (around 5.5%), City Walk (around 5.5%), Palm Jumeirah (around 4.5%), and most of Dubai Marina (around 6.0% to 6.3%). It puts JLT in roughly the same band as Business Bay (around 6.8%) and slightly behind JVC and Discovery Gardens (which can deliver 8% plus but with different risk profiles).
Net yields, after factoring in service charges, agent fees on annual lettings, occasional void periods, and minor maintenance, typically land between 5.4% and 6.5% in JLT. The spread between gross and net is wider for older towers (higher service charges relative to rent) and narrower for newer towers in better buildings.
Taimur Khan, CBRE’s research head for the Middle East, has noted that secondary apartment yields across Dubai have compressed over the past two years as capital values have risen faster than rents. JLT has held its yield better than the city average because rents have grown alongside capital values rather than lagging them. That’s an important point. In some Dubai districts, the yield numbers you see published reflect outdated rents that are about to step-change upward at renewal. In JLT, the published yields are mostly real-time.
Where JLT compares less well: pure rental growth from a low base. Districts like JVC and Dubai South have seen larger percentage rental moves over the past three years because they started from cheaper rents. JLT rents have grown at a more modest pace because they were already at sensible levels in 2022.
Where JLT Rents Have Moved
Rental growth in JLT between 2022 and 2025 has run between 35% and 65% depending on cluster, with the higher end of that range concentrated in the central and amenity-rich clusters. This is faster than the long-term Dubai average and slower than the peak-yield districts. It is, however, more durable.
A breakdown of the rental movement by typical unit:
• Studio apartments across older clusters: average rent moved from AED 45,000 in 2022 to AED 68,000 in 2025
• One-bedroom apartments in mid-tier towers: from AED 65,000 in 2022 to AED 100,000 in 2025
• One-bedroom apartments in lake-facing premium towers: from AED 80,000 in 2022 to AED 130,000 in 2025
• Two-bedroom apartments in mid-tier towers: from AED 95,000 in 2022 to AED 150,000 in 2025
• Two-bedroom apartments in lake-facing premium towers: from AED 120,000 in 2022 to AED 195,000 in 2025
• Three-bedroom apartments across the district: from AED 160,000 in 2022 to AED 240,000 in 2025
The pattern is consistent. Premium tower rents grew faster in absolute terms but the percentage growth was actually slightly stronger in mid-tier towers because they started from a lower base. Lake-facing premiums have expanded as a percentage of base rent, which means buying a lake-view unit today carries a bigger premium than it did three years ago. Studios and one-bedrooms moved faster than larger units because tenant demand at those price points has been strongest.
Cross-referenced against the Dubai Land Department rental index, JLT’s rental growth has tracked the citywide apartment median almost exactly, with slightly stronger performance in central clusters and slightly weaker performance in the outer ring.
A useful frame for thinking about JLT rents: they move with the broader Dubai market but with less volatility on the downside. During the 2020 pandemic compression, when some Dubai districts saw rents fall 15% or more, JLT held within a 5% to 8% pullback before recovering. The reason was tenant stickiness. DMCC employees and free zone workers didn’t leave Dubai in the same numbers as some other resident groups, and the towers within walking distance of their offices retained occupancy better than purely investor-driven buildings further out.
That tenant stickiness is a yield asset that doesn’t show up in headline numbers but matters enormously in real returns. A 7% gross yield on paper means nothing if you have three months of void each year. A 6.5% gross yield with 11.5 months of occupancy in most years is the better deal. JLT’s tenant retention rates run noticeably above the Dubai apartment average, particularly in towers with strong building management.
Capital Growth vs Yield Trade-off
JLT’s capital appreciation over 2022 to 2025 ran between 30% and 55% depending on cluster, with the strongest growth concentrated in Uptown Tower and adjacent premium buildings and the weakest growth in the older, peripheral clusters. The citywide apartment average over the same period was around 45%.
This is where the JLT investment thesis splits into two camps. The yield maximisers want the older mid-tier towers in clusters E, G, and the outer ring. Lower purchase prices, similar rents, higher gross yields, but slower capital growth. The total-return investors want the central clusters and the newer premium buildings. Lower yields but stronger capital appreciation that more than makes up the difference.
Which strategy is right depends on the holding period and the investor’s other holdings. For shorter holds (3 to 5 years), the higher-yield older towers usually deliver better total return because the entry price is lower and the rental income compounds faster. For longer holds (7 plus years), the central premium buildings usually outperform because capital growth has time to dominate the total return.
Faisal Durrani, Knight Frank’s head of Middle East research, has written about this trade-off across multiple Dubai apartment districts. The pattern in JLT broadly tracks his framework. Income today versus growth tomorrow, with a clear bifurcation by cluster and tower vintage.
A common mistake we see: investors picking a single tower based on a friend’s recommendation or a single agent’s pitch without comparing the yield and growth profile against alternatives within JLT itself. The variance within JLT is large enough that picking the wrong cluster can cost 1.5 percentage points of yield or 15 percentage points of three-year capital growth.
Another mistake: assuming that the highest-yield cluster is automatically the best investment. The outer JLT clusters do deliver the highest gross yields, but they also have the longest void periods, the weakest tenant pool, and the slowest capital growth. A 7.8% gross yield with a typical 8-week void each turnover, plus 2 percent net annual capital growth, is worse over a five-year hold than a 6.5% gross yield with 2-week voids and 5 percent net annual capital growth. The total return math runs against the gross yield. We’ve watched investors make this mistake several times and regret it within the first re-letting cycle.
The strongest investors we work with in JLT tend to think in total return terms from the start. Gross yield gets you in the door of the conversation. Net yield, void rates, service charge trajectory, building management quality, and capital growth potential are what actually decide which unit is the right buy.
Our Research: What Actually Delivers in JLT
We pulled data on 110 actual JLT transactions from our own records and Property Monitor between January 2023 and February 2025, covering studios through three-bedroom units across 22 clusters. We then layered rental data over the purchase prices to calculate realised gross yields. The headline finding: realised yields are slightly below advertised yields, but not by much, and the gap is smaller in JLT than in most other Dubai districts.
The cluster-level summary, sorted by net yield delivered:
Cluster T (mid-tier towers, not Uptown), realised net yield: 6.3%. Three-year capital growth: 38%.
Cluster S (Goldcrest Views area), realised net yield: 6.1%. Three-year capital growth: 41%.
Cluster J (Bonnington and similar), realised net yield: 5.9%. Three-year capital growth: 44%.
Cluster E (Saba Towers area), realised net yield: 6.4%. Three-year capital growth: 36%.
Cluster G (Madina Tower and similar mid-tier), realised net yield: 6.5%. Three-year capital growth: 32%.
Outer clusters (combined), realised net yield: 6.6%. Three-year capital growth: 28%.
Uptown Tower itself, realised net yield: 5.2%. Three-year capital growth: 55%.
What this tells us. Cluster T (excluding Uptown), Cluster J, and Cluster S deliver the best balance of yield and growth. Clusters E and G are pure yield plays with steady but slower capital appreciation. The outer clusters maximise yield at the expense of growth. Uptown Tower is the inverse, with growth that has run ahead of the rest of the district but yields that are closer to Downtown than to legacy JLT.
For investors targeting net yields of 6% plus with reasonable capital growth, the sweet spot is Cluster S, Cluster T mid-tier, or Cluster J. For investors who want maximum income today and accept slower growth, the outer clusters work. For investors who want maximum capital growth and accept yield compression, Uptown is the play.
Which JLT Buildings Actually Perform
The cluster averages tell part of the story. The building-level picture is where the real money is made or lost. Some specific buildings worth flagging:
1. Goldcrest Views 1 and 2 consistently deliver close to advertised yields with minimal void periods. Tenant retention is high. The management is one of the better ones in JLT.
2. Bonnington Tower has been a strong serviced-apartment performer. Yields are slightly lower than standard residential, but voids are almost nonexistent and the upside from short-let licensing is real where the building permits it.
3. Saba Tower 1, 2, and 3 rent quickly, almost too quickly. The trade-off is that the rent ceiling is real. Don’t expect outsized rental growth from these towers, but expect predictable income.
4. MAG 214 is one of the better value plays in the older cluster ring. Purchase prices have lagged, yields are strong, and the building has aged better than several of its neighbours.
5. Lake Point Tower lake-facing units are among the most reliable rental performers in JLT. Inland-facing units in the same tower yield meaningfully less.
6. Uptown Tower for capital growth, not yield. The amenity package and brand carry a premium that rental income hasn’t fully caught up to yet.
7. Madina Tower and similar Cluster G buildings offer entry prices below the JLT median with rents that have grown faster than the building’s purchase prices, which has expanded yields over the past three years.
Avoid: small studios in towers built before 2007 without verifying the service charge history and the building’s reserve fund status. A few JLT towers carry deferred maintenance issues that show up as service charge step-changes within a year or two of purchase. Always pull the service charge ledger before signing.
What to Expect From JLT as an Investor
The bottom line on JLT for investors looks like this. Reliable yields. The cluster delivers what it advertises, with realised yields close to gross yields. Moderate but durable capital growth. Not the fastest-growing district in Dubai, but consistent and underpinned by real tenant demand. Tenant pool depth. The DMCC free zone, the metro connection, the cluster of nearby workplaces, and the price-to-quality ratio sustain a deep pool of tenants. Liquidity at exit. JLT transactions happen regularly and the secondary market has enough buyers that exits don’t require deep discounting.
Risks to be aware of:
1. Service charge variance across towers is wider than most investors assume. Always verify before purchase
2. Tower-specific maintenance issues can change the economics of a unit overnight. Building inspection matters
3. The off-plan supply pipeline in greater Dubai is significant and could pressure rents in JLT over the medium term, though the centrally located JLT towers are insulated by location
4. The Sobha Uptown effect on the district’s pricing structure is still working through, with some adjacent buildings seeing pull-up effects that may or may not be sustainable
5. Currency and global capital flow dynamics affect Dubai apartment investment broadly, and JLT specifically because foreign investors are a meaningful share of the buyer pool
The strongest investment case in JLT today, looking at the data, is in mid-tier towers in central clusters with strong management and a track record of stable service charges. Entry at AED 1.4 to AED 2.0 million for one-bedroom units, delivering 6.0% to 6.5% net yields, with three-year capital growth running 35% to 45%. That’s the JLT base case for the kind of investor who wants reliable performance rather than home runs.
If you’re considering specific buildings, our team can pull live data on yield, void rates, and service charge history before you commit. The variance across JLT towers and similar Dubai cluster districts is wide enough that the building selection matters as much as the district selection. For buyers focused on yield, our hot properties listings often include JLT units with strong rental track records. The team handles JLT investment transactions regularly, and if you’re ready to look at specific units, reach out and we’ll take it from there.
Related stories

Buying Resale in Dubai vs Abu Dhabi: The Hidden Differences
Buying resale in Dubai vs Abu Dhabi: the hidden differences in fees, land authorities, ownership zones, and process, an
Fujairah Property: The Quiet Emirate Nobody Talks About
Fujairah property, honestly: the UAE's quiet east-coast emirate, its lifestyle appeal, the thin market and limited owne
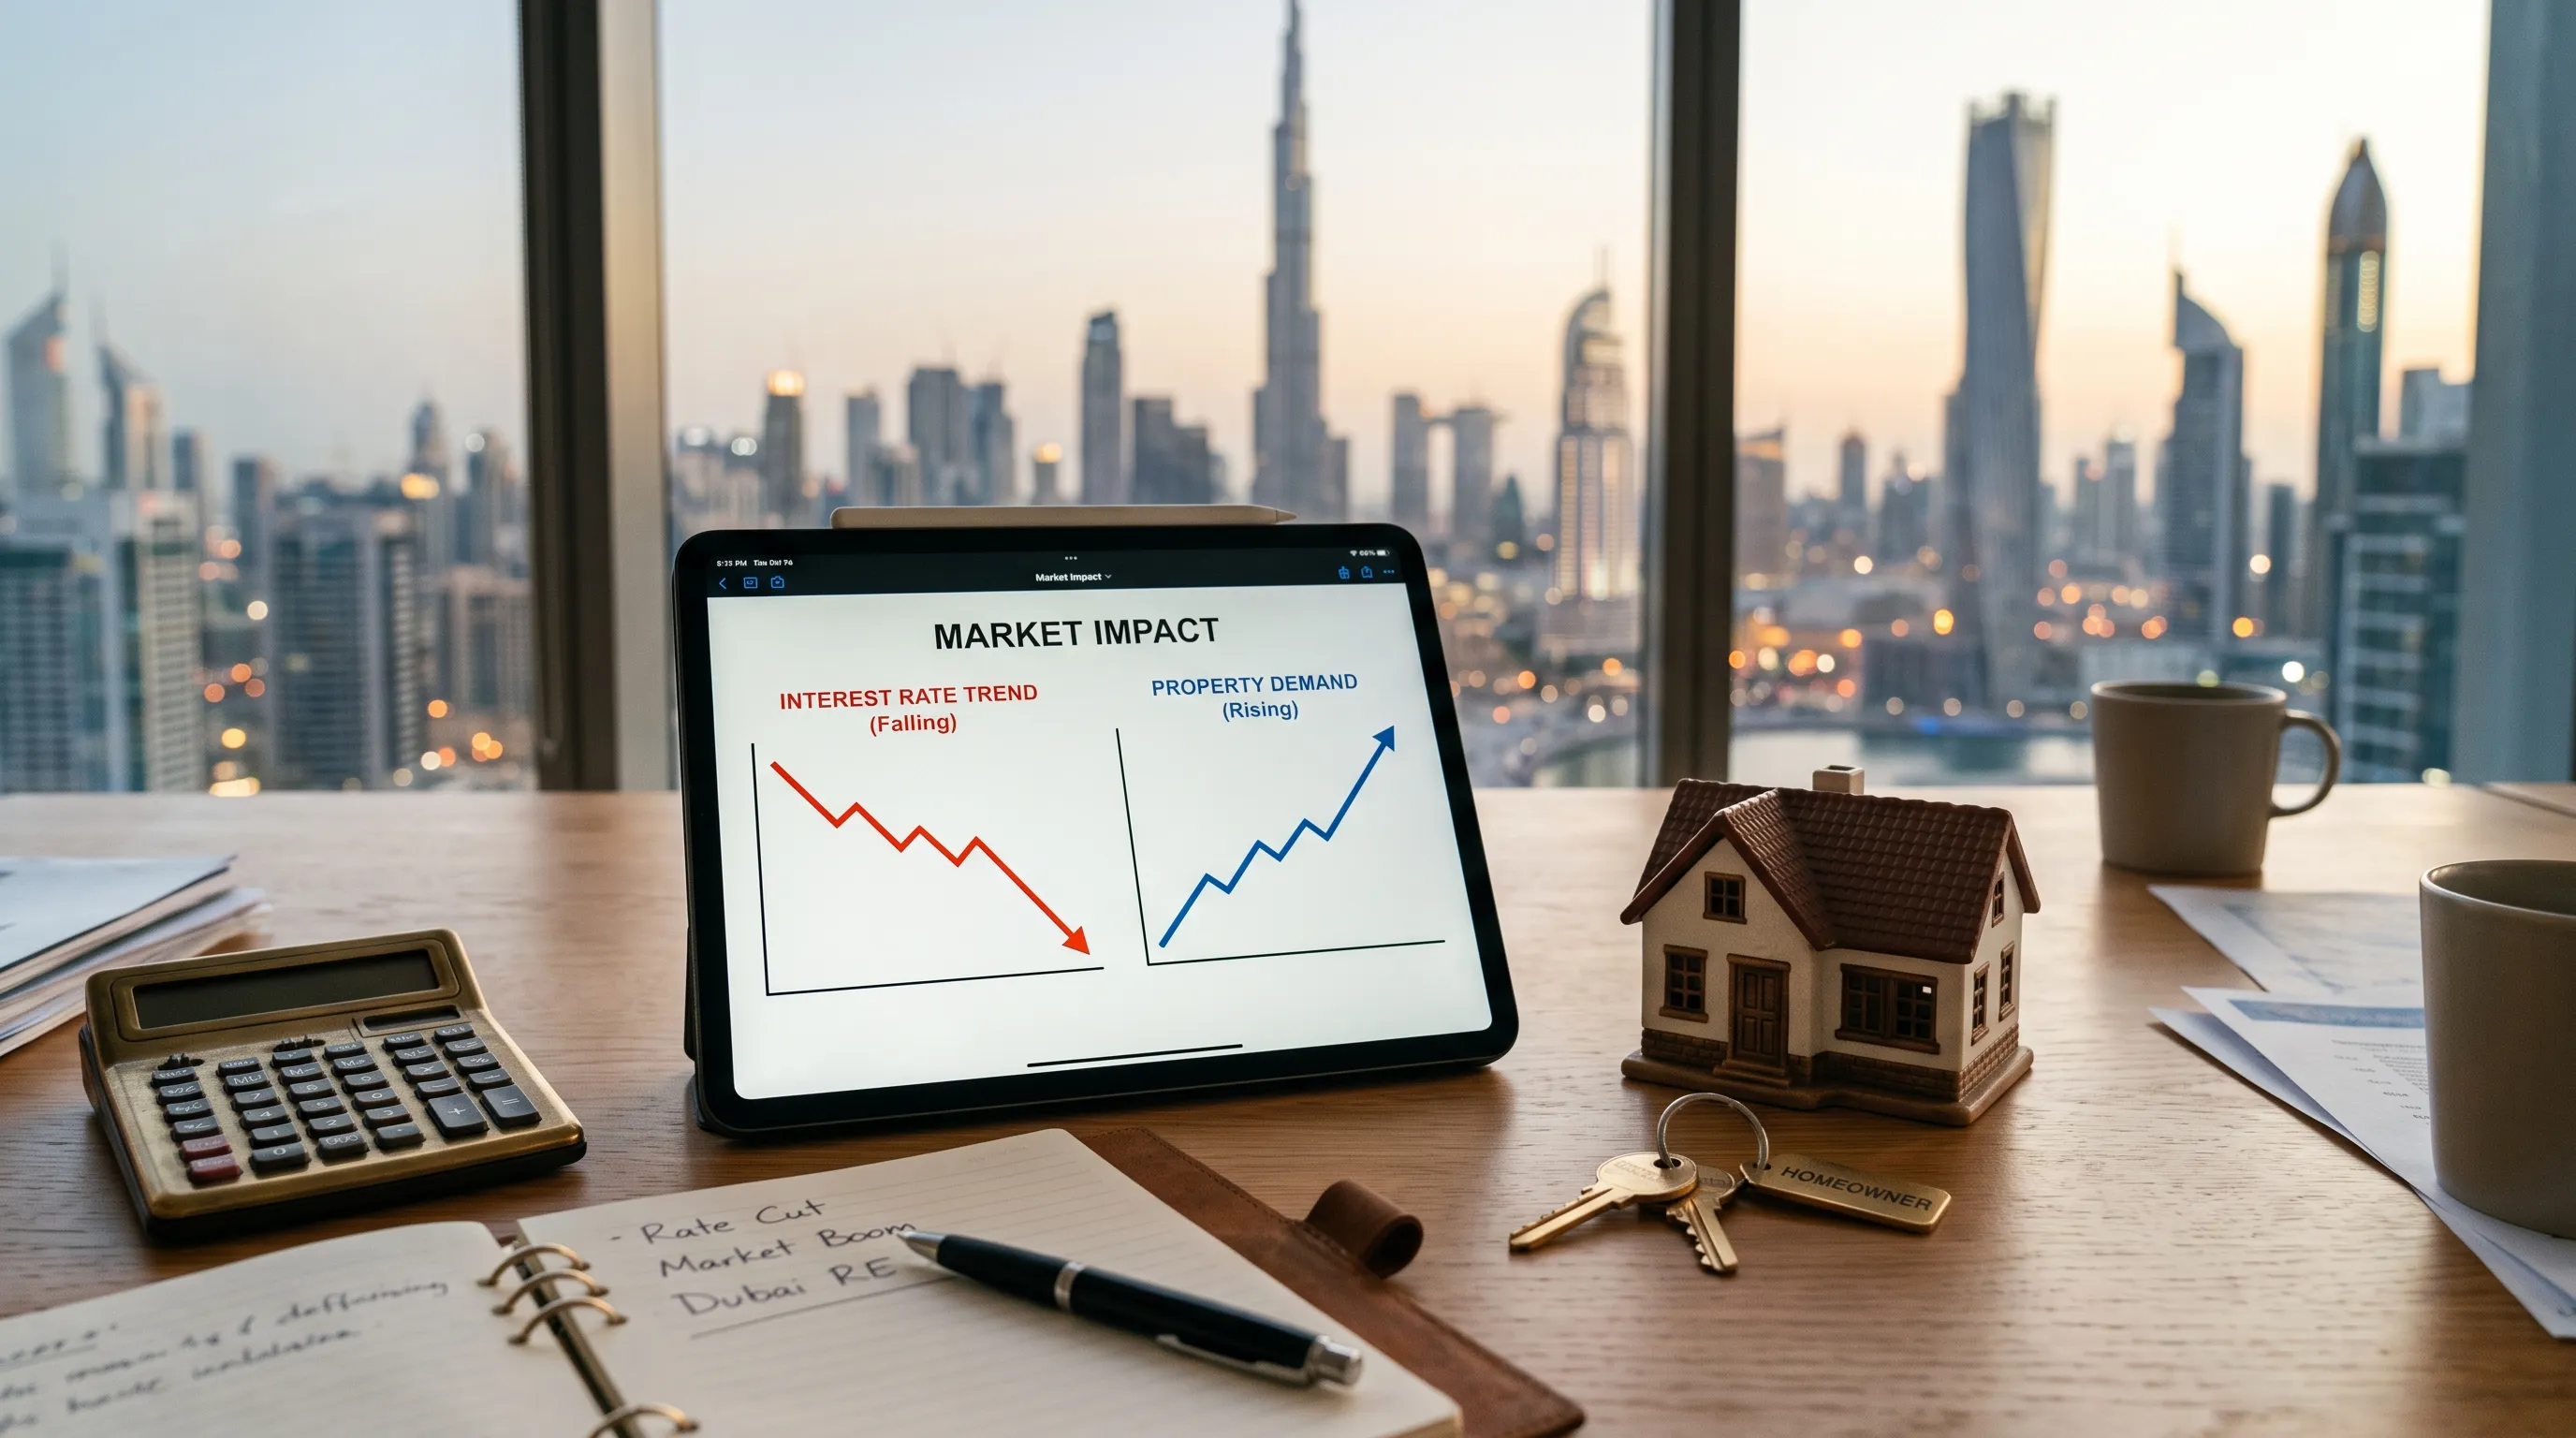
How Interest Rate Cuts Affect Dubai Property: What Buyers Should Know
How interest rate cuts affect Dubai property: why UAE rates track the US, how cheaper mortgages move demand and prices,
Echoes, in your inbox
One thoughtful email a month. Market insight, new launches, no spam.